
On this page
Event details, together in the console
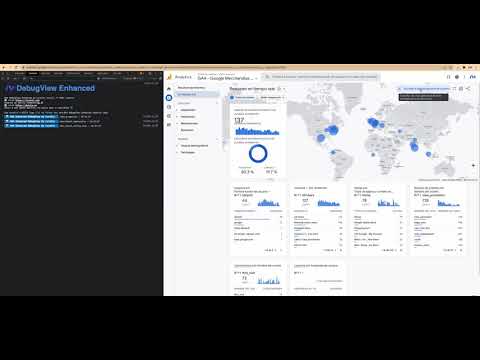
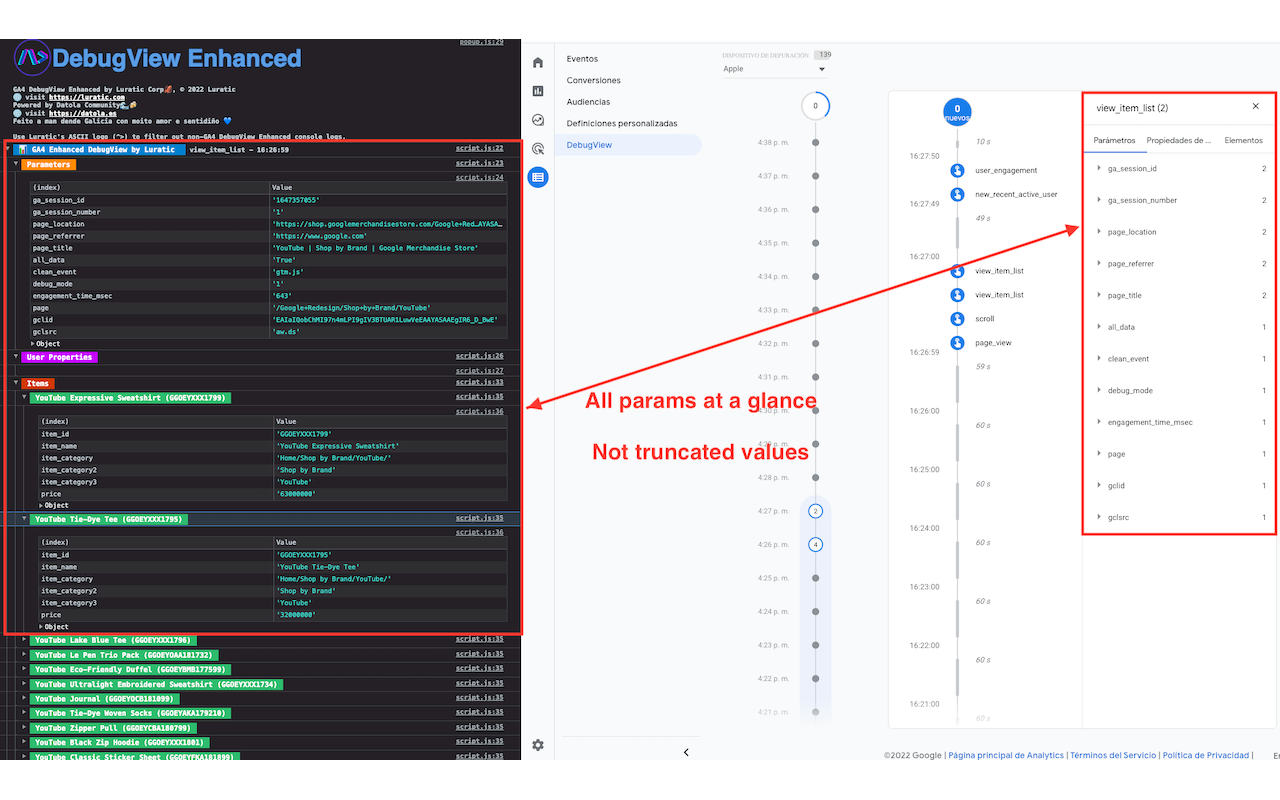
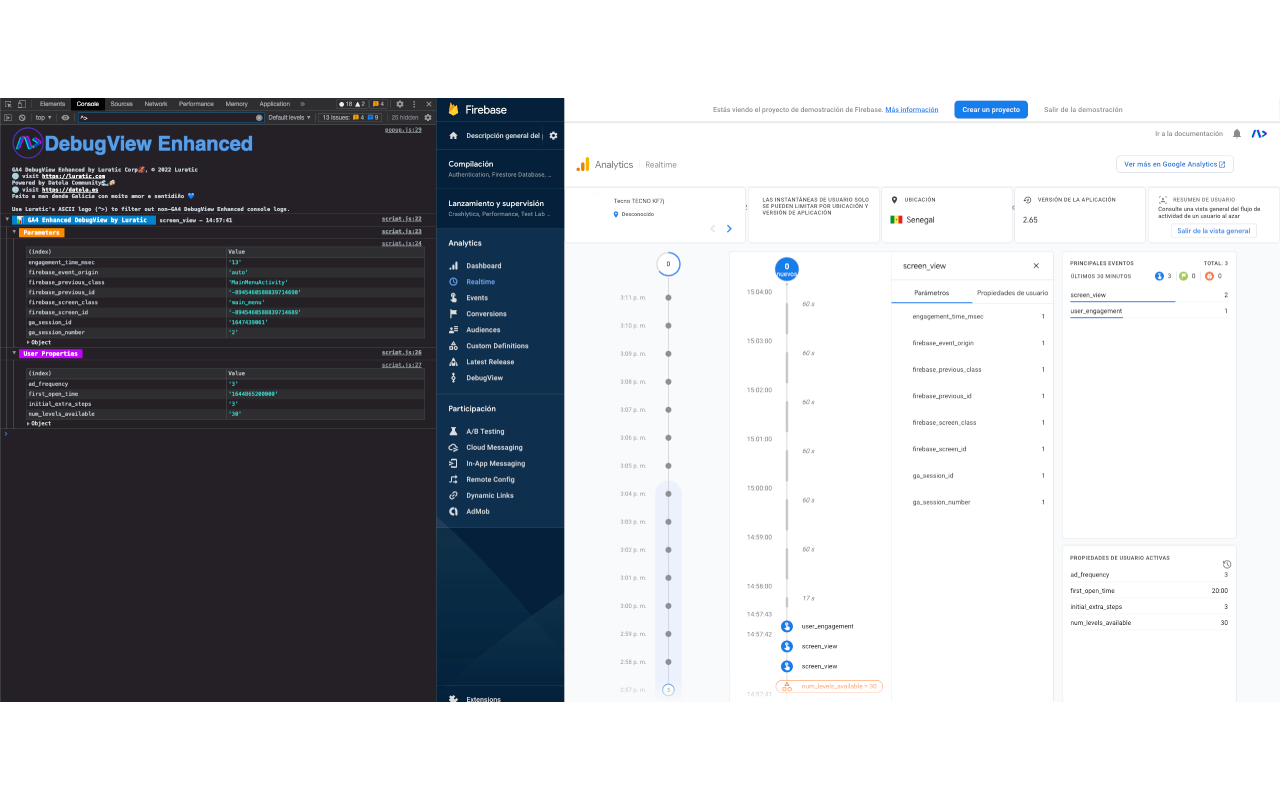
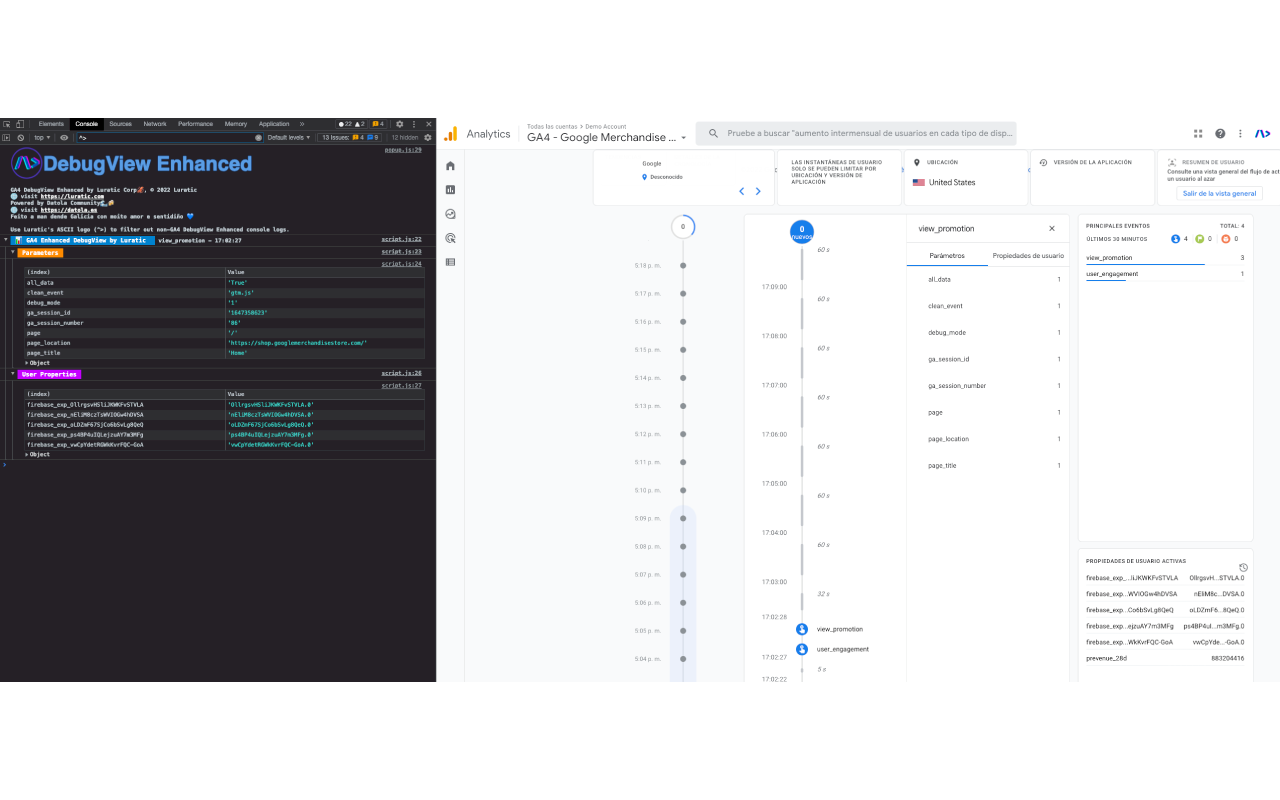
GA4 Enhanced DebugView shows information from the events you select in GA4 or Firebase DebugView directly in the Chrome console. You work in the Console tab of DevTools: select an event in DebugView and review its data there in grouped form.
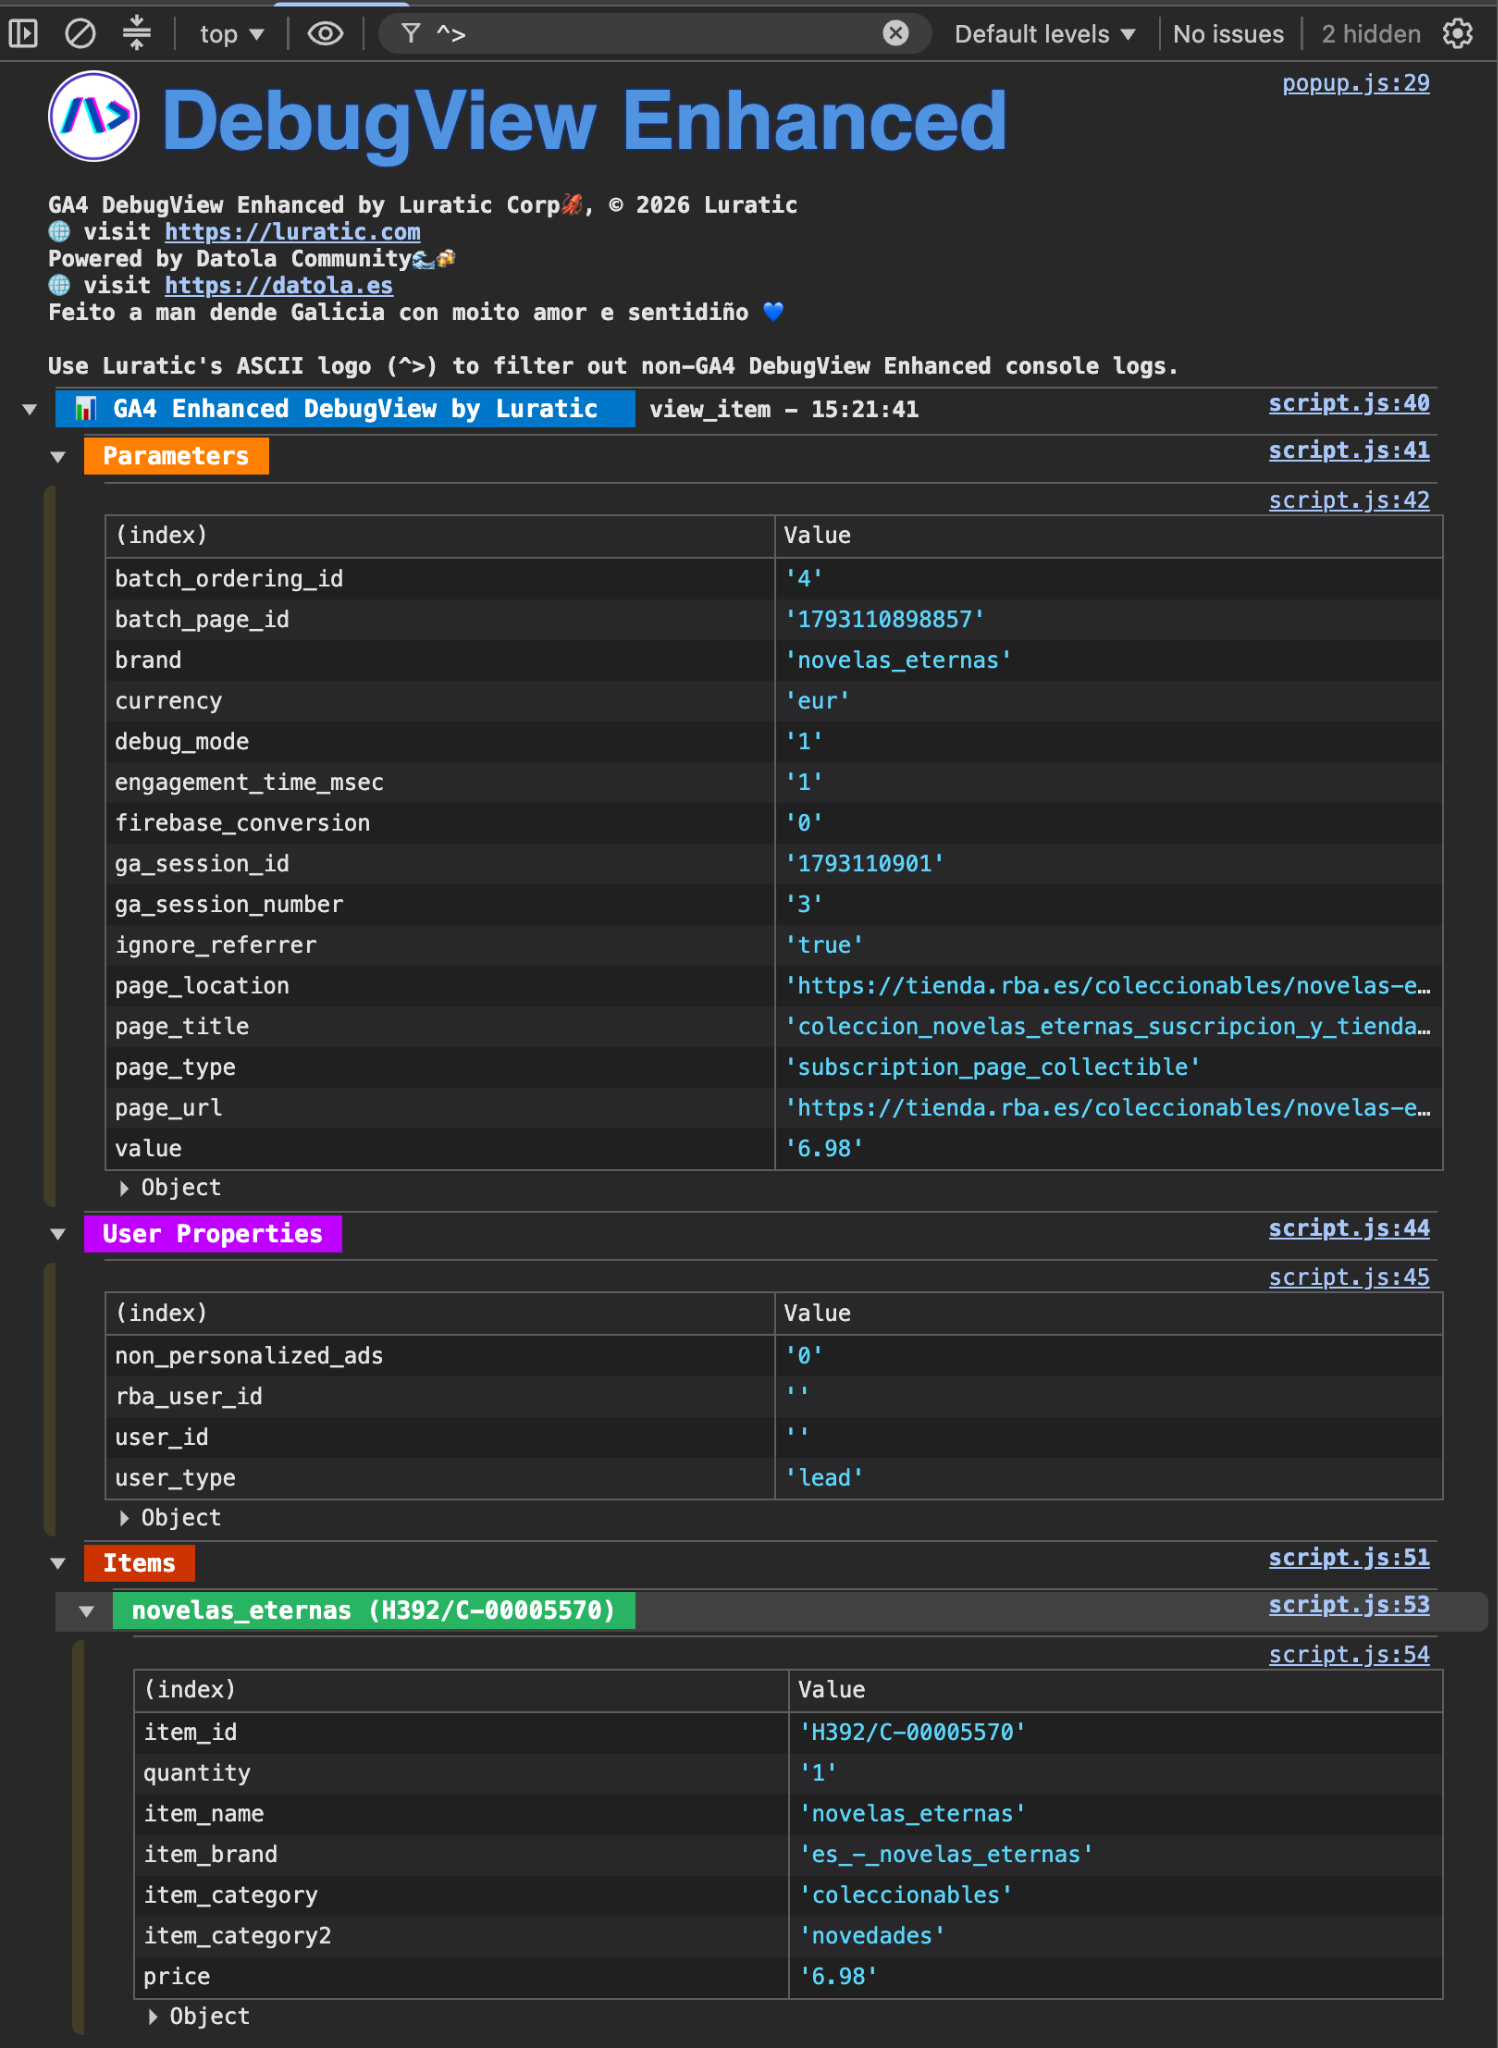
The current output includes the event name and time, collapsible groups, value tables and expandable objects. The Chrome Web Store listing also covers Usersnapshot.
Parameters, User Properties and Items
The console organizes the result into three groups:
| Group | What you can review |
|---|---|
| Parameters | Event parameters and values, shown in a table and as an expandable object. |
| User Properties | Available user properties, with both a table and an object view. |
| Items | Product information grouped by item, with fields and values whenever the event contains ecommerce data. |
You can collapse and expand groups to focus on the part you are validating. To find extension output among other console messages, type ^> in the console filter: that is the Luratic marker shown in the screenshot.
When it is useful
During an implementation, confirming that an event arrived is only part of the job; you also need to compare its data with the measurement plan. Grouped output makes it easier to go through test events and compare values with variables configured in GTM or in the application.
The extension helps you read the data. Validation of business rules is still your responsibility.
A practical example: review a test purchase
You have prepared a purchase flow in a test environment and want to check what Analytics received. When the event appears in DebugView, select it and inspect the available parameters in the console.
Under Parameters, compare transaction_id, currency and value with the expected transaction. Under User Properties, review the available user context; under Items, open each product and inspect fields such as item_id, quantity or price.
Those names are examples of what you might validate. The actual data depends on the received event: the extension does not add missing parameters or correct their values.
Then select another event in the flow and compare its contents. If you find a difference, go back to the tag configuration or the code that generates the data and investigate the source.
How to use it
- Install GA4 Enhanced DebugView from the Chrome Web Store.
- Open the GA4 property or Firebase project you want to review and prepare a test session with debug mode enabled.
- Open DebugView and select the test device if several are available.
- Enable the extension from its Chrome icon.
- Open DevTools and the Console tab on the Analytics or Firebase page where you are using DebugView.
- Type
^>in the Console filter if you want to focus on extension messages. - Select an event from the timeline and expand Parameters, User Properties and Items depending on what you need to inspect. Open objects for more detail.
For websites, Google documents Tag Assistant and Preview mode as ways to enable device debugging. For apps, follow the specific Firebase DebugView instructions.
What the result means
The event must already be available in the interface you are inspecting. Enabling the extension does not by itself enable debug mode on your website or app, and it does not cause new events to be sent.
If the event does not appear in DebugView, check the property, device and debugging setup. If the event appears but you do not see extension output, confirm that the extension is enabled and that you have the correct console open. Check console filters and message levels as well.
The integration depends on the structure of Google interfaces, which may change. Verify its behavior in your own environment before making it part of a validation procedure. When you need to compare what happens during transmission, complement this review with GTM Preview or your site’s network requests.
Installation and references
The Chrome Web Store listing contains the published version, permissions and privacy declarations. See the Google Analytics DebugView guide as well for details about the timeline, devices and parameters.
Developed by Luratic, with support from the Datola community acknowledged in the extension listing.
Credits
Luratic; the store listing credits support from the Datola community.